Notating the Environment Workshop
Explore creating environment-based music for performers and the sounds of nature. The session includes work with field recording, listening, composition and interaction practices led by composers Josten Myburgh and Lindsay Vickery.
Resources
|
Some Score Examples
Notated Transcription: Olivier Messiaen:
Topographical Score: David Dunn Score based on natural structures: Polwechsel Score based on recorded structures: Cheryl Leonard Audience Score: Matthew Burtner Meteorological Data: R. Murray Schafer Duration times for notated musical events: Charles Underriner Graphic Score: Sebastiane Hegarty Spectrographic Score: Robert Erickson |
|
Background Reading
|
Ecostructuralism
Zoomusicology Field Recording Instruments and field recording Notation |
Opie, Timothy and Brown, Andrew (2006) An Introduction to EcoStructuralism. In Proceedings International Computer Music Conference, pages pp. 9-12, New Orleans, USA.
Krause, Bernard. (1987). The niche hypothesis: How animals taught us to dance and sing. Whole Earth Review, 57(57), 14-16. López, Francisco. (2019). Sonic Creatures. Vickery, L., Terren, M., Gillies, S. Myburgh, J. (2016). Between the Real and the Imaginary: Ecostructural Approaches to Composing with Field Recordings and Acoustic Instruments. Sonic Ecology: Australasian Computer Music Conference 2016, Brisbane Vickery, L. (2020). Notational strategies for integrating live performers with complex sounds and environments, Tenor2020 , Hochschule für Musik und Theater, Hamburg. |
|
Composer interviews
|
Rebecca E. Smith – under over through [2019]
|
Useful Digital Tools
Audacity a free audiofile editor
|
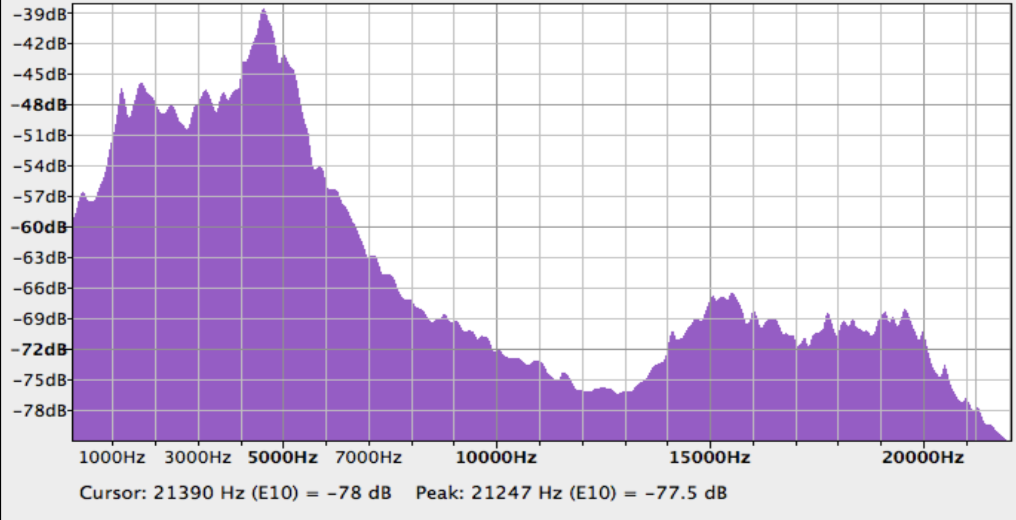
Example use: To discover prominent frequencies in a region of an audio recording - something like "the harmony" of the recording. Environmental recordings tend to have bands of frequencies that are occupied almost exclusively by certain animals, Bernard Krause called this the Habitat Niche Hypothesis.
Description of the Tool: In Audacity the Plot Spectrum tool takes the selected audio (which is a set of sound pressure values at points in time) and converts it to a graph of frequencies (the horizontal scale in Hz) against amplitudes (the vertical scale in dB). The image to the right is an example. Method: Load audio into Audacity, Select some audio (up to 237.8 seconds at the standard 44,100 Hz sample rate), choose Plot Spectrum from the Analyze Menu. Drag the cursor over the spectrum to identify frequencies visually or export the data. More information here |
|
Sonic Visualiser a free spectrogram creator
|
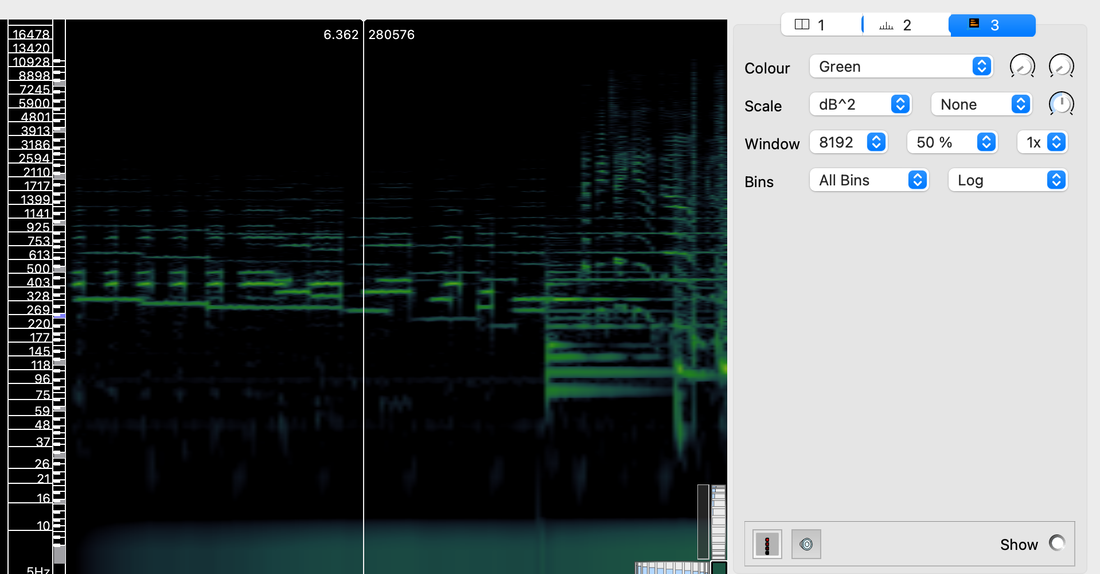
Example use: to visualise the prominent frequencies in an audio recording graphed over time to allow precise synchronisation between performers and pre-recorded materials.
Description of the Tool: an application for viewing and analysing the contents of music audio files. Method: Load audio into Sonic Visualiser. Go to the Layer menu and choose Add Spectrogram > All Channels mixed. You can change the settings on the right to get a clearer visualisation, the setting on the right are a good place to start. DOCUMENTATION video text |
|
Listening
|
|
|
|